Choosing an Email Outreach Platform by Industry - The Analytics Scorecard That Predicts Pipeline
Adrian NguyenJuly 1, 202610 min read
Choosing an email outreach platform is less about who has the prettiest dashboard and more about whether the analytics match your industry reality: what counts as a good reply, how fast meetings should happen, and how safely you can iterate without hurting deliverability.
Key takeaways
Ignore inflated opens and “reply rate” without intent classification; prioritize qualified replies, meeting velocity, and closed-won attribution.
Build reporting around how your industry sells: SaaS needs ICP and meeting conversion, agencies need client and offer segmentation, recruiting needs reply quality and domain safeguards.
Pick an email outreach platform that can instrument a repeatable decision loop: test, measure, diagnose, and change one variable at a time.
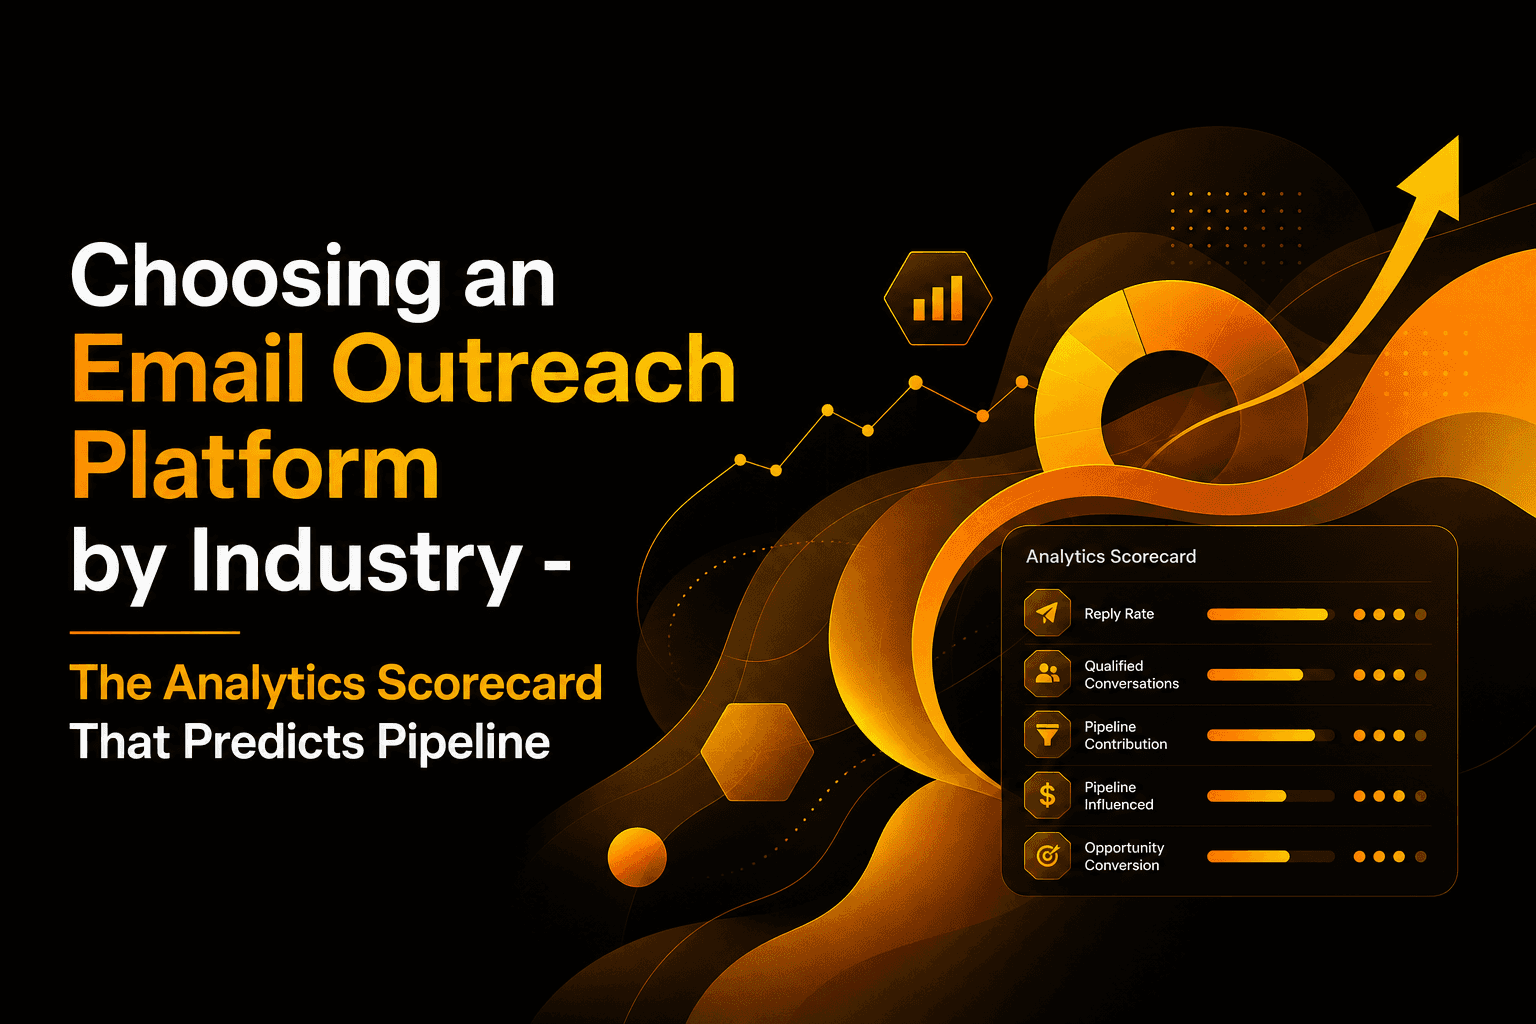
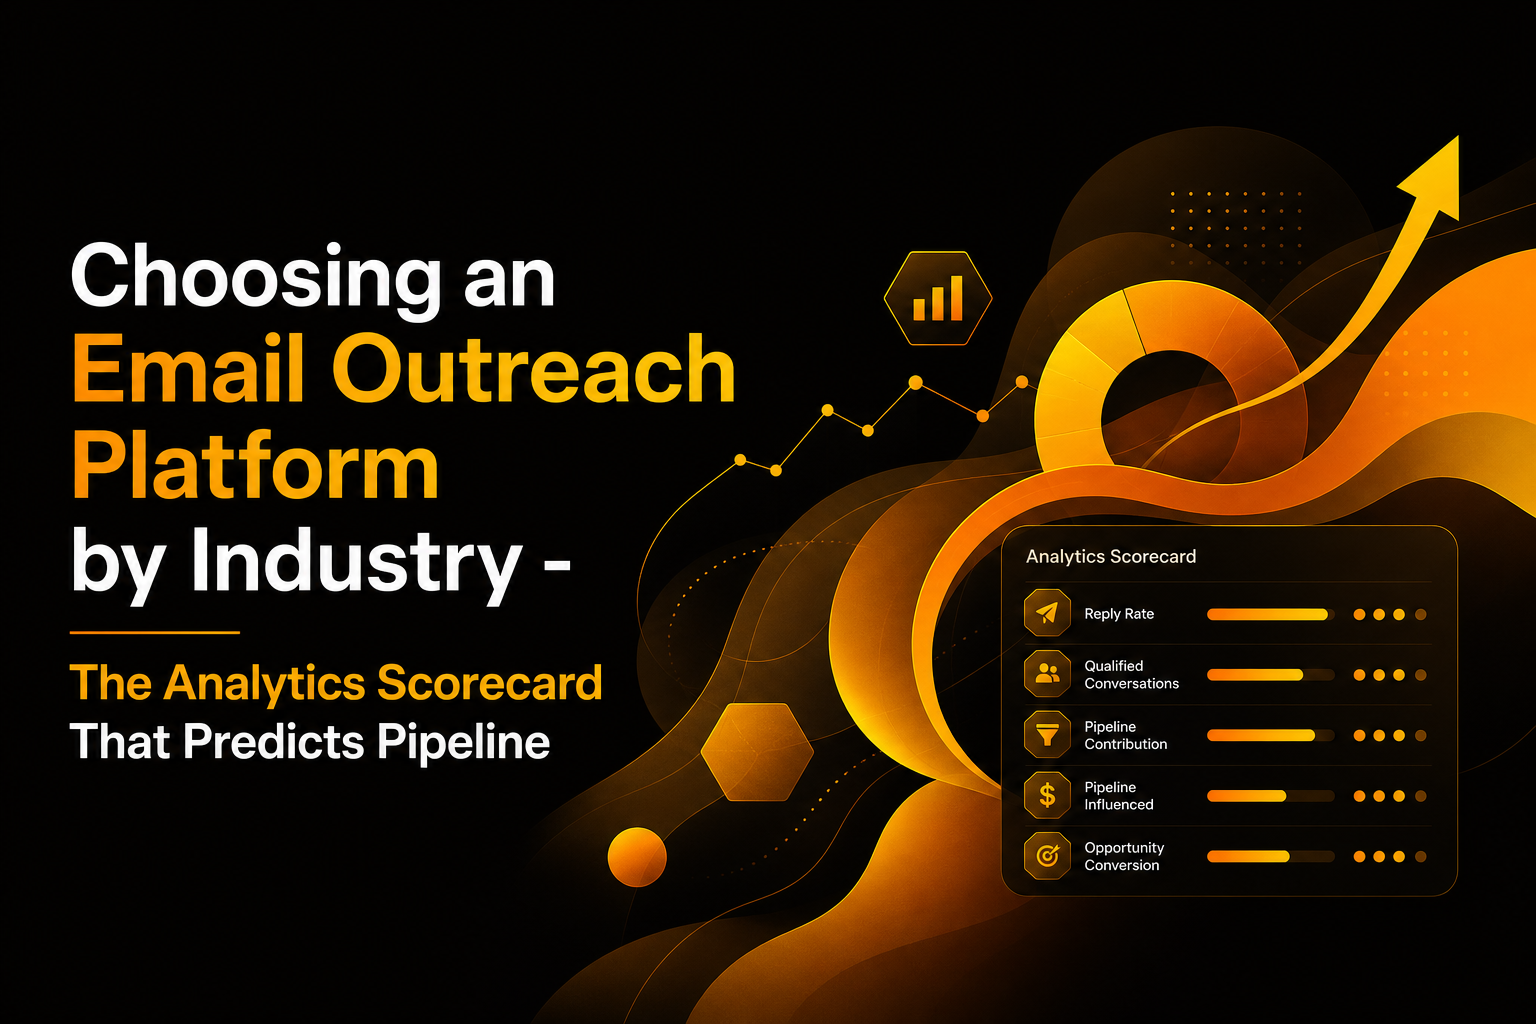
An industry-based analytics scorecard for evaluating outbound performance beyond opens.
What “Good” Analytics Looks Like in an Email Outreach Platform Beyond Opens
Persona context: You are responsible for outbound results, but you are also the person who gets blamed when deliverability drops or the team chases vanity metrics. “Good analytics” means you can answer one question weekly: What should we change next to increase qualified meetings without increasing risk?
Why opens and clicks are unreliable decision signals
Opens are increasingly noisy because security scanners and privacy protections can trigger tracking pixels. This is widely documented in industry discussions around Apple Mail Privacy Protection and enterprise link scanning behavior. For background, see Apple Mail Privacy Protection.
Clicks can be bot activity when scanners “pre-click” links for safety checks, especially in larger organizations.
Raw reply rate is easy to inflate if you count “unsubscribe,” “stop,” and auto-replies the same as buying intent.
So the minimum viable analytics stack for an email outreach platform should make it easy to separate signal (intent, meetings, revenue) from noise (bots, OOO, unsubscribes).
The minimum viable analytics stack (MVAS) for outbound
Use this as a scorecard when evaluating any email outreach platform. If you cannot measure these reliably, you will struggle to iterate safely.
Deliverability health: bounce rate, spam complaint indicators, inbox placement proxies, and alerts when thresholds are trending risky.
Engagement quality: reply classification (positive, neutral, negative), and the ability to exclude OOO and unsubscribe replies from performance reporting.
Conversion events: meetings booked (with calendar attribution), meeting show rate (if available), and pipeline or closed-won attribution (via CRM integration or export).
Segmentation: performance by ICP slice, offer, persona, domain type (SMB vs enterprise), and sequence step.
Experiment tracking: A/B testing for subject lines, first lines, CTAs, and follow-up cadence with clean comparisons.
A weekly decision loop that prevents “random acts of outbound”
Here is a practical loop you can run every week, regardless of industry. It keeps changes controlled so you do not tank your sender reputation.
Pick one primary KPI (qualified reply rate or meetings booked rate) and one safety KPI (bounce rate or spam signals).
Diagnose by layer: delivery issues (bounces), message-market mismatch (negative replies), or CTA friction (replies but no meetings).
Change one variable: list targeting, personalization pattern, subject line, or follow-up spacing. Avoid changing copy, list, and cadence at the same time.
Set a sample threshold: do not call a winner on 30 sends. As a rule of thumb, wait until each variant has at least a few hundred sends in the same ICP slice, unless you see clear safety issues.
Document learnings: what changed, for whom, and what moved. This becomes your outbound playbook.
If you need a refresher on structuring outbound so the data you collect is interpretable, see cold outreach.
SaaS and Tech Sales Teams - Analytics That Predict Meetings, Not Vanity Metrics
Persona context: You sell a product with a defined ICP, a sales cycle that often starts with a demo, and a pipeline that lives in HubSpot or Salesforce. Your biggest analytics failure mode is optimizing for “activity” instead of meeting creation and pipeline quality.
Challenges unique to SaaS outbound analytics
ICP drift: reply rate looks good, but meetings are unqualified (wrong company size, wrong tech stack, wrong geography).
Sequence step confusion: a follow-up gets the reply, but the opener did the persuasion. Without step-level reporting, you change the wrong thing.
Calendar bottlenecks: reps get positive replies but fail to convert them into booked meetings quickly.
SaaS scorecard - what to measure weekly
Qualified reply rate (QRR) by ICP slice (industry, company size, job title).
Meetings booked per 1,000 delivered and median time-to-meeting from first send.
Positive-to-negative reply ratio by value prop and persona.
Step contribution: which step produces the first positive intent signal.
Pipeline attribution: opportunities created and closed-won tied back to sequence and segment.
Concrete benchmark ranges (directional, not universal)
Benchmarks vary by list quality, offer, and domain maturity, but these directional ranges help you spot when something is obviously broken:
Bounce rate: aim to stay under ~2% on cold outbound. If it trends higher, fix list quality before scaling.
Meetings booked rate: many teams target roughly 0.3% to 1.0% meetings booked per delivered email depending on ICP tightness and offer strength.
Qualified reply rate: often more useful than raw reply rate; if QRR is flat while opens rise, your copy is not doing the work.
Instrumentation checklist for SaaS teams
Define “qualified” in writing: for example, “asks about pricing, timeline, integration, or agrees to a meeting.”
Tag every sequence with ICP slice and offer type so reporting can roll up cleanly.
Connect calendars so “meeting booked” is not manual and can be attributed to the original sequence.
Push outcomes to CRM so you can see opportunity creation and closed-won by campaign.
When SaaS teams struggle, it is usually not a lack of personalization ideas, it is inconsistent execution. A repeatable approach to cold email personalization helps you create variants you can actually measure.
Agencies and B2B Services - Proving ROI When Multiple Clients and Offers Are In Play
Persona context: You run outbound for multiple clients or multiple offers. Your analytics problem is not “Do we get replies?” It is “Which client, which offer, and which segment is producing revenue, and can we prove it without cherry-picking?”
Challenges unique to agencies and services
Misleading aggregates: one strong client can mask that three others are failing.
Offer mismatch: the copy is fine, but the offer is wrong for that industry segment.
Attribution gaps: replies happen in email, meetings happen in calendars, revenue is tracked elsewhere.
Agency scorecard - segment-first reporting
To evaluate an email outreach platform for agency use, require reporting that can be segmented at least by:
Client (or business unit)
Offer (audit, retainer, pilot, one-time project)
Persona (founder, VP marketing, ops, etc.)
List source (scraped, enrichment provider, manual research)
A practical ROI model you can show clients
Instead of reporting “open rate went up,” report a simple chain that a client understands:
Delivered (after bounces removed)
Qualified replies (intent-filtered)
Meetings booked (calendar-confirmed)
Opportunities created (CRM stage change)
Closed-won (revenue)
If your email outreach platform cannot connect at least to calendar and export cleanly to a CRM, you end up with screenshots and manual reconciliation.
Concrete example of how segmentation prevents bad decisions
Imagine you run 4,000 sends across two offers:
Offer A (audit): 2,000 delivered, 3.5% replies, but only 0.2% meetings booked.
Offer B (pilot): 2,000 delivered, 2.0% replies, but 0.9% meetings booked.
If you optimize for reply rate, you scale Offer A and your client complains that “outbound does not work.” If you optimize for meetings booked and qualified intent, you scale Offer B and can defend the decision with data.
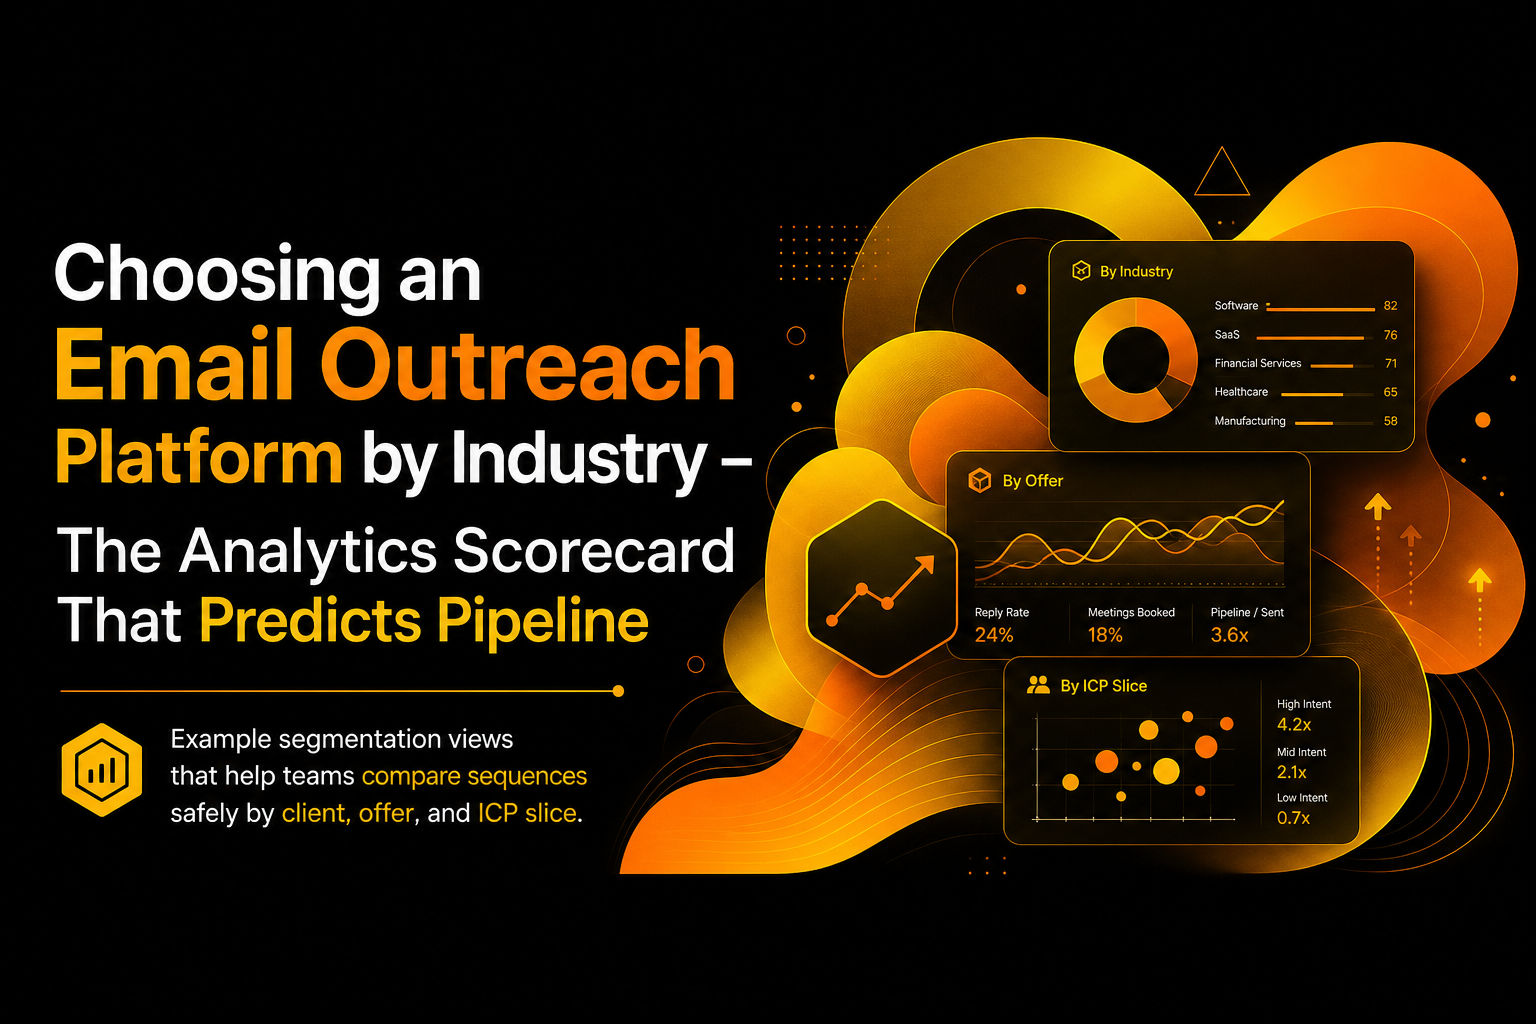
Example segmentation views that help teams compare sequences safely by client, offer, and ICP slice.
Recruiting and Staffing - Measuring Quality Replies While Protecting Domain Health
Persona context: You send higher volume, you often contact people who are not actively looking, and your risk is twofold: damaging domain reputation and burning candidate goodwill. Your analytics must prioritize reply quality and negative signals, not just volume.
Challenges unique to recruiting outbound
High negative reply risk: “remove me,” “stop,” or frustration replies can spike if targeting is off.
List decay: candidate emails change frequently, increasing bounces if you do not verify and refresh.
Timing sensitivity: a good reply today can go cold in 48 hours if follow-up and scheduling are slow.
Recruiting scorecard - what to measure and what to stop doing
Positive reply rate (explicit interest, willingness to talk, asks for details)
Bounce rate and spam risk alerts as hard stop signals for scaling
Deliverability is not optional here. If your domain health slips, every recruiter suffers. If you need a plain-English refresher on what actually impacts inbox placement, read email deliverability.
Workflow instrumentation that protects reputation
Track negative signals by segment: if one job family or geography produces disproportionate negative replies, pause that slice.
Use bounce monitoring as a throttle: if bounces rise above your internal threshold (commonly around 2%), stop and clean lists before continuing.
Measure time-to-first-human-reply: this helps you tune follow-up spacing and recruiter response SLAs.
Industry Scorecard Table - What to Demand From an Email Outreach Platform
This table summarizes the analytics capabilities that matter most by industry. Use it to compare tools during trials without getting distracted by surface-level dashboards.
Industry
Primary outcome metric
Secondary diagnostic metrics
Safety metrics (non-negotiable)
Must-have reporting segmentation
SaaS and tech
Meetings booked per delivered (and time-to-meeting)
Qualified reply rate by ICP slice, step contribution
Qualified replies by niche, CTA conversion, follow-up impact
Deliverability and bounce monitoring
Niche, persona, offer angle, sequence
FAQ on choosing analytics for outbound
How many metrics should I track in an email outreach platform?
Track one primary outcome metric (qualified replies or meetings booked) plus 2 to 4 diagnostic metrics (negative replies, step contribution, time-to-meeting) and 1 to 2 safety metrics (bounce rate, spam risk). More than that usually leads to conflicting decisions.
What is the fastest way to tell if my open rate is misleading?
If open rate is high but qualified reply rate and meetings booked are flat, treat opens as non-actionable. In many environments, opens are inflated by privacy features and security scanners, so use intent-based replies and booked meetings as your decision signals.
How do I compare two sequences fairly?
Compare within the same segment: same ICP slice, same list source, and similar send window. Then evaluate delivered volume, qualified reply rate, and meetings booked per delivered. If you change targeting and copy at the same time, you cannot know what caused the lift.
What should I look for in reporting if I manage multiple senders or reps?
Require rep-level and mailbox-level reporting for bounce rate, negative replies, and meetings booked. One mailbox with poor list hygiene can drag down the whole domain, so you need visibility and the ability to pause or throttle at the sender level.
If you want an email outreach platform that turns these industry scorecards into a tight weekly loop, Outbound Glow is built around intent-based analytics and actionability: it filters noise out of replies, attributes meetings back to sequences via calendar sync, and helps teams iterate while keeping an eye on deliverability health. Explore Outbound Glow when you are ready to measure what actually creates pipeline, not just activity.
Adrian Nguyen
Adrian Nguyen is an expert on automation, SEO and AI fields.
Let's help his spread the words.