
Standard Email Open Rates Are Less Trustworthy Than You Think: What the 2026 Data Suggests
Standard email open rates used to be a quick health check for email performance. In 2026, they are still a useful benchmark, but they are no longer a clean signal of human interest because automated email security checks can trigger opens. This guide shows what “standard” looks like, how to set realistic targets, and what to track alongside opens.
- Use standard email open rates as a benchmark, not a goal. They correlate weakly with revenue when opens are inflated by automated scanning.
- Set targets by email type. “Standard” differs widely between newsletters, product emails, and cold outbound.
- Pair opens with reply quality and meeting outcomes. If opens rise but qualified replies do not, your subject line is winning while your offer is losing.
The Current Landscape (Direct Answer)
Email engagement is shifting from “who opened” to “who took a meaningful action” because security and privacy changes can inflate opens. According to Litmus email marketing benchmarks, open rates vary widely by industry and are best interpreted alongside downstream metrics like clicks and conversions.
50-word summary: Standard email open rates are still useful for spotting deliverability issues and comparing campaigns, but they are increasingly noisy. Automated scanners and privacy protections can trigger opens without real reading. The practical shift is to treat opens as a “screening metric” and validate performance using replies, meetings, and pipeline impact.
Critical Benchmarks for 2026 (The Data Table)
There is no single universal “standard,” so the only honest way to benchmark standard email open rates is by message type and list temperature (warm subscribers vs. cold prospects). Industry reports typically show broad ranges rather than one number.
How to use the table: pick the row that matches your email type, then set “Your Target” based on whether you are optimizing for attention (opens) or outcomes (replies, meetings, revenue).
| Metric | Industry Average (Typical Range) | Top 10% Performer (Typical Range) | Your Target (Practical Starting Point) |
|---|---|---|---|
| Newsletter open rate (warm list) | 20% to 30% (varies by industry) | 35% to 45% | 30%+, then focus on clicks and conversions |
| Product or lifecycle email open rate (users/customers) | 25% to 45% | 45% to 60% | 40%+ for key lifecycle moments |
| Cold outbound open rate (B2B) | 30% to 50% (often inflated by scanning) | 50% to 70% (may include non-human opens) | Use opens as a deliverability check; target replies and meetings |
| Reply rate (cold outbound) | 1% to 5% | 6% to 12% | Start at 3%+, then segment by persona and offer |
| Meeting booked rate (cold outbound) | 0.2% to 1% | 1% to 3% | 0.5%+ with a clear, specific CTA |
Source notes (and limitations): Email benchmarks are published as ranges because performance depends on list quality, sending reputation, and industry. Litmus and similar benchmark publishers report variability across sectors rather than one “true” number. For cold outbound, many practitioners report higher open rates than newsletters, but those opens can be inflated by automated checks, so treat them as directional rather than statistically significant proof of interest.
Checklist: When “Standard” Open Rates Are Meaningful vs. Misleading
- Meaningful if: you email opted-in subscribers, you see consistent click behavior, and opens move with clicks over time.
- Misleading if: opens spike but clicks and replies do not, opens happen instantly after send, or opens vary wildly by company domain (a common sign of automated scanning).
The Productivity Gap: Analyzing the Numbers
Chasing standard email open rates can create a productivity trap: teams A/B test subject lines endlessly because opens are easy to move, while revenue stays flat because the offer, targeting, or follow-up is the real constraint.
Decision Table: What to Do When Opens Change
| What you observe | Likely cause | What to do next (actionable) |
|---|---|---|
| Open rate up, replies flat | Subject line improved but message relevance did not | Rewrite the first 2 sentences around a specific pain and proof; test one offer change at a time |
| Open rate down, replies up | Fewer opens but better targeting or stronger offer | Keep the segment; broaden carefully; do not “fix” the subject line too fast |
| Open rate up, bounce rate up | List quality issue or risky sending pattern | Clean the list and investigate deliverability; revisit your understanding of bounce rate meaning |
| Open rate stable, meetings up | Offer clarity and follow-up timing improved | Document the winning sequence and replicate to adjacent segments |
Framework: Use Opens as a “Gate,” Not the Finish Line (4 Steps)
- Validate deliverability first: If your cold outbound open rate is consistently below ~25% to 30%, treat it as a potential inbox placement problem, not a copy problem.
- Segment before you optimize: Compare standard email open rates by persona, industry, and company size. If one segment is 2 standard deviations below the rest, your targeting or subject line fit is off for that segment.
- Optimize for intent signals: Track positive replies, specific questions, and meeting requests. Opens should correlate with these; if not, opens are noise.
- Scale only after stability: Increase volume when bounce and complaint signals stay stable and qualified replies rise, not when opens jump.
If you are running cold outreach, this approach prevents a common failure mode: celebrating “great” open rates while your list quality quietly degrades and reply quality drops.
Expert Predictions & Strategic Shifts
Based on benchmark volatility and the market trend toward tighter inbox filtering, the next 6 months will reward teams that treat standard email open rates as a secondary metric and invest in three operational shifts.
Shift 1: From “Open Rate Goals” to “Outcome Targets”
- Prediction: Open rates will remain directionally useful but less statistically significant as a measure of human attention.
- Do this in the next 30 days: Set targets for (1) qualified reply rate and (2) meeting booked rate per segment, and review weekly.
- Tooling implication: Use analytics that separate low-quality replies (OOO, unsubscribe) from real interest. Outbound Glow, for example, emphasizes qualified replies and meeting attribution so you can see whether “better opens” actually lead to pipeline.
Shift 2: Personalization That Is Consistent, Not Fancy
- Prediction: Generic messages will get filtered faster; relevance will be the durable lever.
- Do this in the next 60 days: Standardize 3 personalization fields you can apply to every prospect (role pain, trigger, proof) and keep them consistent across your sequence.
- Practical next step: Build a repeatable cold email personalization system where each line maps to a verifiable detail, not a vague compliment.
Shift 3: Domain Health as a Weekly Routine
- Prediction: Deliverability will become a bigger differentiator than copywriting for teams scaling outbound volume.
- Do this in the next 2 weeks: Create a weekly checklist: bounce monitoring, complaint monitoring, and pausing rules when risk spikes.
- Why it matters: If your domain reputation drops, standard email open rates can fall across every campaign, masking which message actually works.
- When open rates rise but revenue does not, the “win” is often an illusion. In many outbound programs, opens are easier to move than qualified replies. The data pattern to watch is open rate volatility combined with reply quality decline. That combination usually signals inflated opens plus weak targeting, not improved messaging.
FAQ: Standard Email Open Rates
What are standard email open rates in 2026?
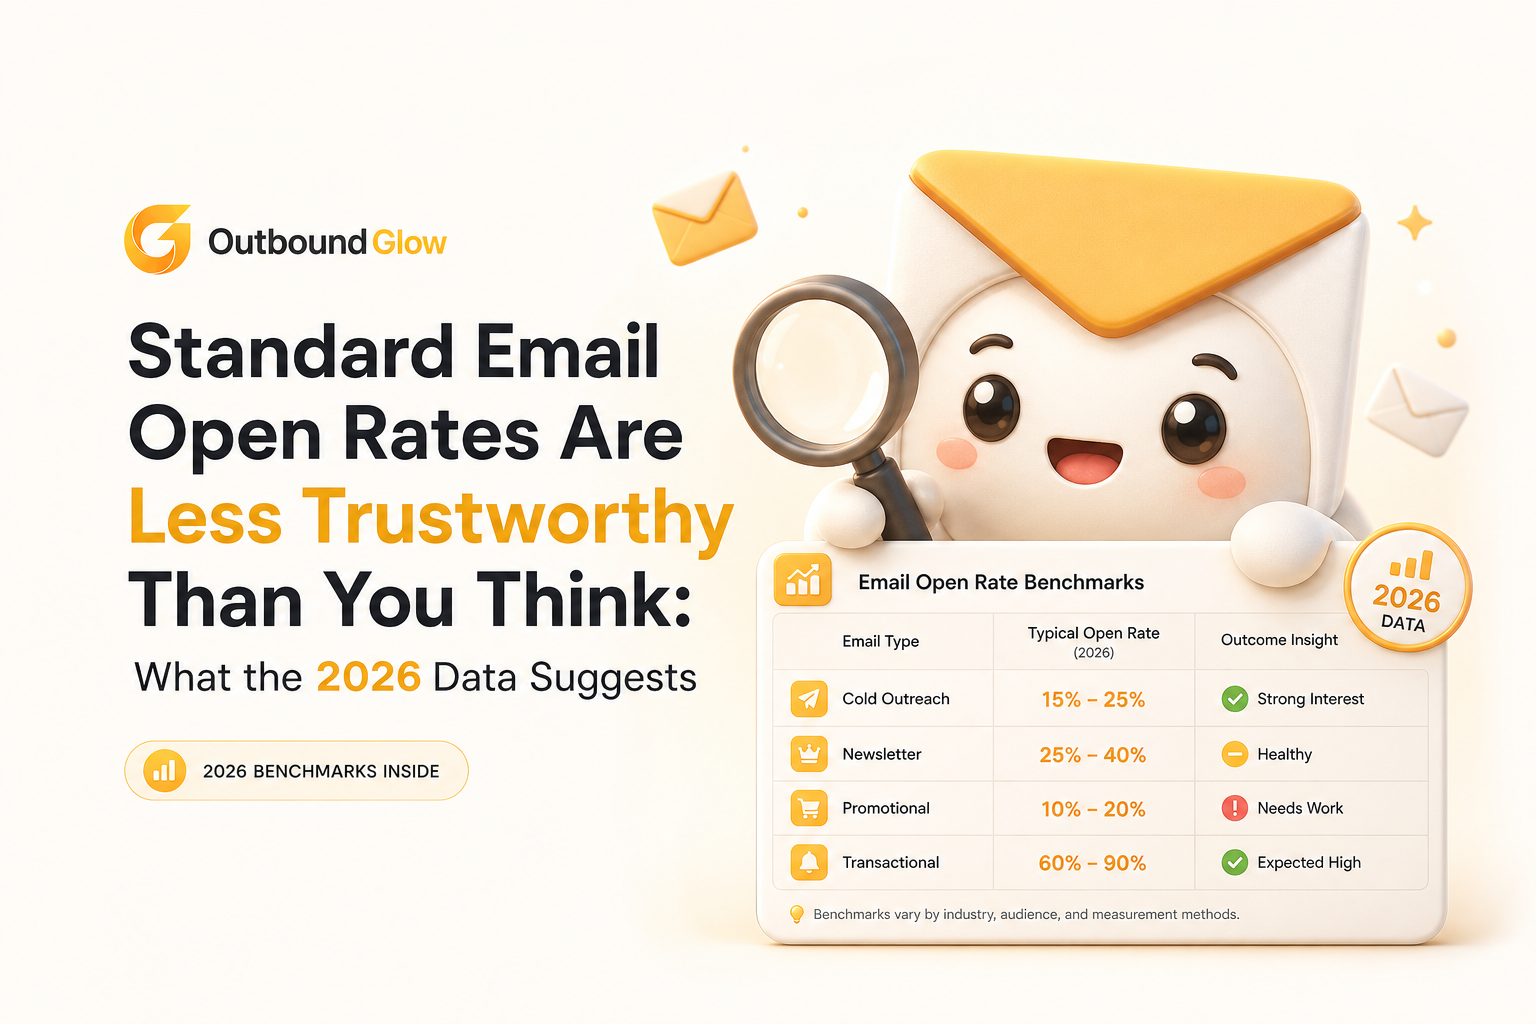
For warm lists (newsletters), industry benchmarks commonly fall around 20% to 30%, with strong programs reaching 35% to 45%. For cold outbound, reported open rates are often higher (30% to 50% or more), but they can be inflated by automated scanning, so benchmark them cautiously.
Are open rates still a reliable KPI?
They are reliable for spotting deliverability problems and comparing versions inside the same program over time. They are less reliable as proof of interest because some “opens” are triggered automatically. Treat open rate as a correlation signal, then confirm with replies, meetings, and conversions.
What is a “good” open rate for cold email?
A “good” cold email open rate is one that stays stable while qualified replies rise. If you need a number, many teams aim for 30%+ as a basic deliverability check. But if you have 60% opens and only 0.5% replies, your standard email open rates are not translating into intent.
How do I set a target if my opens are inflated?
Set targets using a paired metric: choose an open-rate range that indicates inbox placement (for example, not consistently below ~25% to 30%), then set your real goal as qualified replies (for example, 3%+) and meetings booked (for example, 0.5%+). Review by segment, not just totals.
If you want to move beyond standard email open rates and see what your outbound is actually producing, try Outbound Glow to track qualified replies and meetings alongside deliverability signals. Start with one sequence, compare segments, and scale only what proves it creates real conversations.

Stay in the loop
Actionable outbound growth tactics, AI workflows, and founder-tested outreach strategies delivered weekly.