
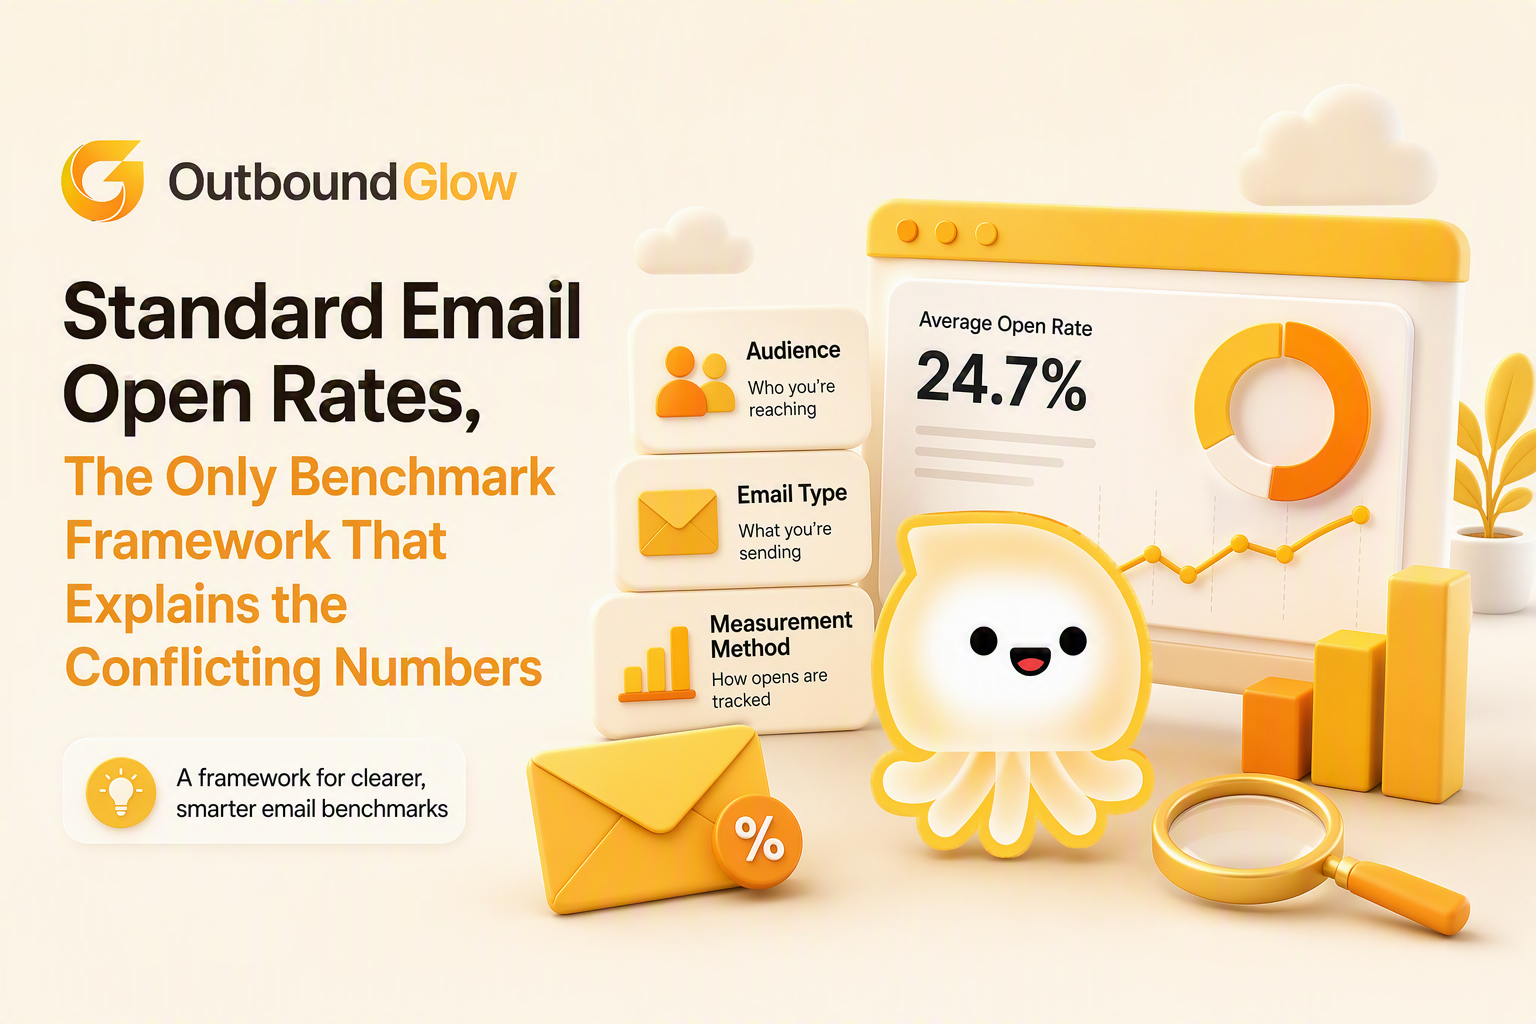
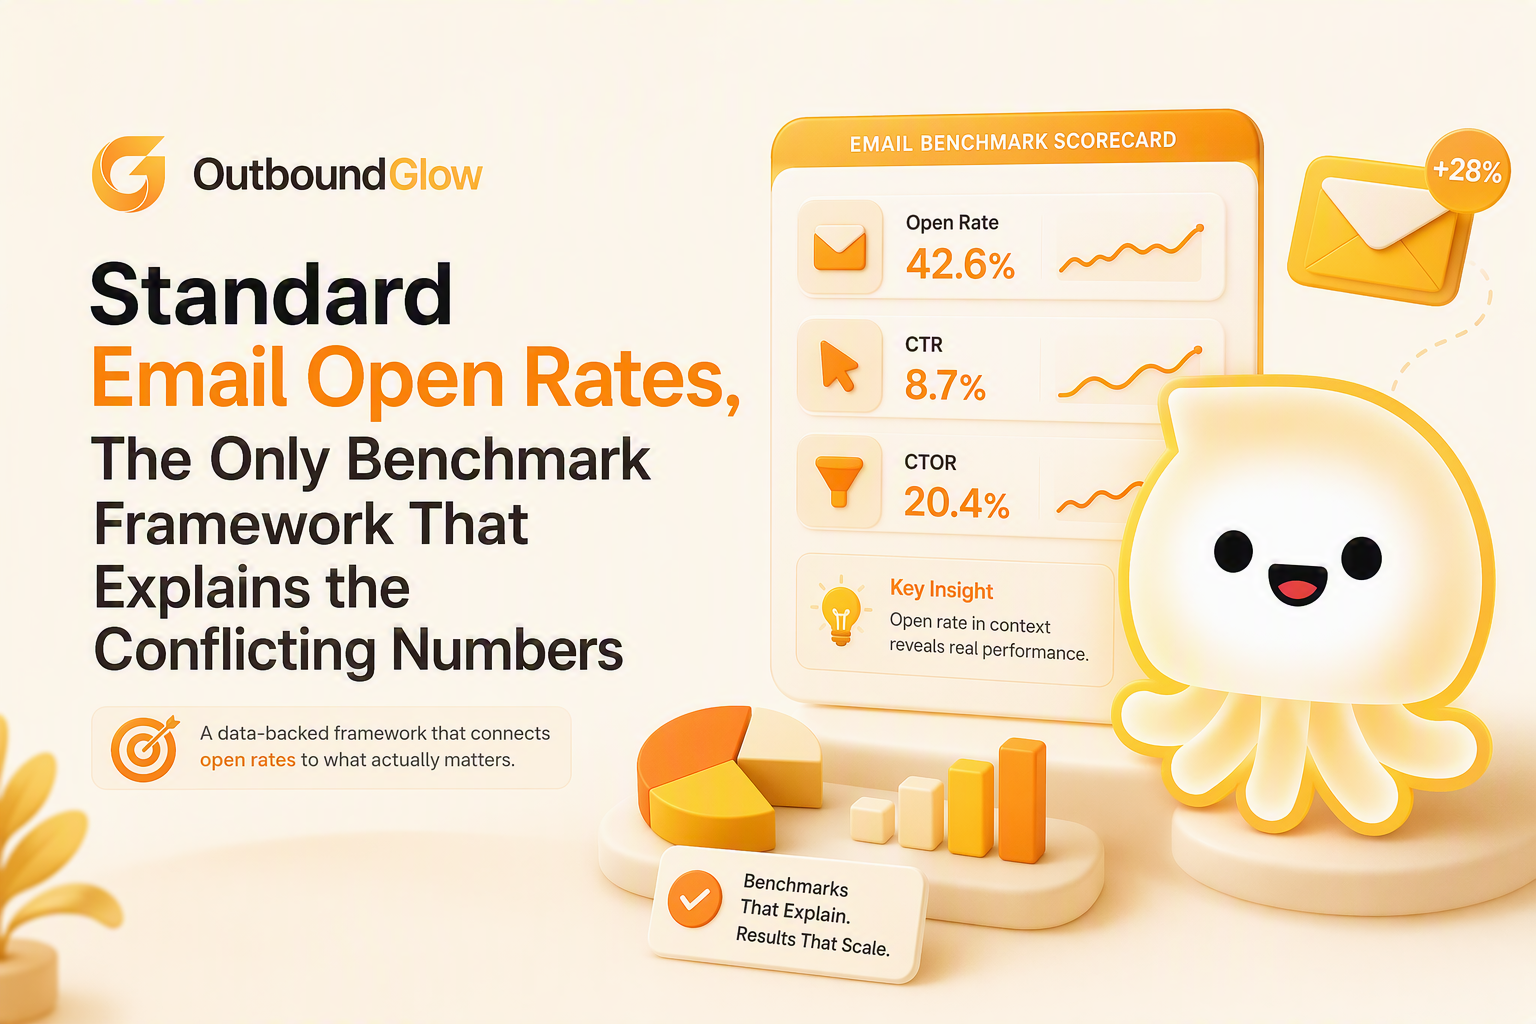
Standard Email Open Rates, The Only Benchmark Framework That Explains the Conflicting Numbers
Learn what standard email open rates mean in 2026, why benchmarks conflict, and how to pick the right range using CTR and CTOR.

So, What's a "Good" Email Open Rate in 2026?
Short answer: there isn't one. Not a single, clean number you can hold up and say "yep, we're good." Open rates depend on who you're emailing, what kind of email it is, how clean your list is, and — thanks to Apple's privacy changes — whether the number you're even looking at is real.
Here's the thing most benchmark articles won't tell you: they're comparing apples to oranges and calling it a fruit salad.
The short version, if you're in a hurry:
Figure out your context first (audience + email type + how you're measuring) before you decide if a number is good or bad.
Don't trust opens alone. Pair them with click-through rate (CTR) or click-to-open rate (CTOR) so you're not optimizing for noise.
If your numbers are low, fix deliverability and list hygiene before you touch subject lines or send times.
Why "Standard Open Rate" Is a Trickier Question Than It Sounds
Before you can call any number "standard," you need to answer three boring but important questions: what's your denominator, what counts as an open, and is your data quietly inflated by privacy tools you didn't ask for.
First, check your math
Two teams can look at the exact same campaign and report two different open rates, just because they're dividing by different things:
Open rate (delivered) = unique opens ÷ delivered emails. This is the one most marketing teams default to.
Open rate (sent) = unique opens ÷ sent emails. This one folds bounces into the number, so really it's measuring deliverability and engagement at once.
If you're about to compare your number to some "industry benchmark," make sure you're both using the same denominator first. Otherwise you're not really comparing anything.
An "open" doesn't mean what it used to
Technically, an open gets logged when a tiny invisible tracking pixel loads. Sounds simple enough. Except in 2026, that pixel loads for reasons that have nothing to do with a human reading your email:
Apple's Mail Privacy Protection can pre-load images automatically, which counts as an "open" even if nobody looked at anything. (Apple has documented this behavior themselves.)
Corporate security scanners do the same thing — they open emails and click links automatically, especially in cold outreach.
So at this point, treat your open rate as a directional signal. A vibe check on inbox placement and subject-line pull, not a precise measurement of who's actually reading.
"Unique opens" helps, but it's not a fix
Most dashboards report unique opens instead of total opens, which cuts down on inflation from someone opening the same email five times. But it doesn't solve the bigger problem. We've personally watched open rates jump overnight right after a change on the inbox provider's side, while replies and booked meetings stayed completely flat. That's not a real improvement. That's just noise dressed up as a win.
Why Every Benchmark You Find Disagrees With the Last One
They disagree because most of those "average open rate" reports quietly mash together completely different audiences, email types, and tracking setups into one tidy headline number. It looks authoritative. It isn't.
Ask yourself these four things before trusting any benchmark
Audience: B2B, B2C, nonprofit, or a mix? Corporate spam filters and recipient intent are wildly different across these.
Email type: newsletter, promo, transactional, or cold outreach? Transactional emails behave differently because people are expecting them.
List source and freshness: opt-in, purchased, scraped, event-based, CRM? This changes everything about how "warm" your audience actually is.
How you're measuring: heavy Apple Mail share? Lots of security scanning? If so, trust your open rate less and lean on CTR, CTOR, or replies instead.
And before you trust the source itself, ask:
Does it separate B2B from B2C, transactional from promotional?
Is it recent, and does it account for post-MPP tracking issues?
Or is it one of those "average across all industries" numbers that don't actually tell you anything useful?
Does it even bother defining delivered vs. sent, unique vs. total?
If a benchmark can't answer these, treat it as a vague reference point — not a target you're trying to hit.
Okay, But What Range Should I Actually Expect?
Honestly, ranges are more honest than fixed numbers here, and even then, your own historical baseline (same audience, same domain, same tracking setup) beats any outside benchmark.
B2B newsletters (opt-in): usually moderate. The trend line matters more than any one number.
B2C promotions: more volatile; subject line and timing can swing this a lot.
Nonprofit updates: can run high when trust is strong, but it moves with the season and the urgency of the ask.
Transactional emails (receipts, login links): typically the highest, because people are expecting and want that email.
Cold outreach: the messiest of all: scanners inflate opens, so replies are the number that actually matters.
Rather than chasing some mythical "industry average," the real question is: which of these buckets does my campaign fall into, and what's actually happening under the hood measurement-wise?
Quick gut-check: is 25% good?
For an opt-in newsletter to an engaged list? Worth investigating, especially if it used to be higher and CTR is also slipping.
For cold outreach? Could be totally fine, though just check reply rate and qualified replies, since opens are noisy here anyway.
For transactional email? That's a red flag. Something's probably broken in deliverability or rendering.
And 35%?
B2B opt-in: probably healthy, assuming CTR/CTOR aren't tanking.
B2C promo: could be genuinely strong, just double-check it's not Apple MPP inflating the number, by looking at clicks and conversions too.
Cold outreach: only "promising" if replies and meetings are moving with it. Otherwise, that's scanner traffic, not people.
From working with a lot of outbound-heavy B2B teams, the most trustworthy signal isn't the open rate on its own. It's whether opens move together with clicks, replies, and booked meetings. If opens go up and everything else stays flat, don't celebrate yet.
Stop Trusting Opens in Isolation — Use CTR and CTOR
If you only remember one thing from this post, make it this: opens tell you almost nothing on their own. Pair them with click data and you'll actually know what's going on.
CTR (click-through rate) = unique clicks ÷ delivered
CTOR (click-to-open rate) = unique clicks ÷ unique opens
Here's a quick example to make this concrete. Say you send 10,000 emails, get 4,000 unique opens, and 200 unique clicks:
Open rate: 4,000 / 10,000 = 40%
CTR: 200 / 10,000 = 2%
CTOR: 200 / 4,000 = 5%
If your open rate is climbing but your CTOR is dropping, that's usually Apple MPP or scanners inflating the top-line number and not more people actually engaging.
Which one should you actually watch?
Use open rate when you're diagnosing inbox placement. New domain, deliverability cleanup, subject line tests, and you don't expect clicks anyway.
Use CTR when the goal is traffic or conversions and there's a clear call to action.
Use CTOR when you want to isolate how good the message itself is, especially if you suspect your opens are inflated.
For cold outreach specifically, you often don't even include links on purpose. In that case, reply rate and qualified replies are your real engagement signal. Opens are just a deliverability check.
A Simple Benchmark Sheet You Can Steal
Here's a lightweight way to turn all of this into something you actually use, instead of a philosophy you nod along to and forget.
Track these columns:
Audience (B2B / B2C / nonprofit)
Email type (newsletter / promo / transactional / cold)
Sent
Bounced (or delivered, if your ESP gives you that directly)
Unique opens
Unique clicks
Apple Mail share (low/medium/high — rough estimate is fine)
Security scanning risk (especially relevant for outbound)
Formulas:
Delivered = Sent - Bounced
Open rate = Unique opens / Delivered
CTR = Unique clicks / Delivered
CTOR = IF(Unique opens > 0, Unique clicks / Unique opens, "")
Then build a simple lookup table with rows for your main contexts (B2B newsletter, B2C promo, nonprofit, transactional, cold outreach), and for each one note:
Expected open-rate range (your own history first, external benchmarks second)
Which metric validates it — CTR, CTOR, or replies
Whether to discount opens if Apple Mail share is high
From there, label each campaign:
Below standard: open rate is under your low bound and the validation metric is also down
At standard: open rate is in range, or opens look noisy but the validator held steady
Above standard: open rate beats your high bound and the validator actually improved too
This one habit stops the most common mistake teams make: high-fiving over an "above average" open rate that never turns into a click, a reply, or a dollar.
If Your Numbers Are Low, Fix Things in This Order
Don't touch your subject lines yet. Fix the plumbing first. Then copy and cadence can come later.
1. Deliverability and domain health (do this first, always)
Make sure SPF, DKIM, and DMARC are actually set up correctly.
Watch bounce and spam-complaint trends. Any sustained spike means pause, don't scale.
Ramp volume gradually, especially on newer or recently-warmed domains.
2. List hygiene (unglamorous, but it's the real multiplier)
Strip hard bounces immediately, don't let them linger.
Quarantine risky patterns: generic role accounts, anything correlated with bounces or complaints.
Sunset segments that have gone quiet, on a schedule, before mailbox providers start deciding for you that people ignore you.
Across a lot of deliverability audits, the pattern keeps repeating: teams that treat list hygiene like a weekly chore get steadier open rates and fewer "why did this suddenly drop" mysteries than teams that only clean house after a campaign flops.
3. Segmentation, subject lines, and send times
Segment by persona, industry, lifecycle stage, or intent source, and benchmark each one separately instead of lumping everyone together.
Test subject lines one variable at a time: curiosity vs. specificity, short vs. long, personalization or none.
Test send times last, once deliverability and segmentation are stable, or you'll end up chasing variance that isn't really there.
4. If you're doing cold outreach specifically
Your first email needs to earn the open through actual relevance, gimmicks wear thin fast, and the bar is stricter here.
If your audience runs security-scan heavy, consider skipping links in early touches, and judge success by replies and meetings instead of opens.
If you're spinning up new sending infrastructure, actually think through whether you need warmup. Don't just run it on autopilot because everyone else does.
How the Best Outbound Teams Actually Operationalize This
Turning all of this into a real workflow means locking down your definitions, tracking a leading metric alongside a validating one, and building in guardrails so "optimizing" doesn't quietly wreck your domain reputation.
A simple operating checklist:
Pick your benchmark context up front, audience, email type, delivered vs. sent. And actually write it down somewhere.
Pair every open-rate goal with a validator: CTR, CTOR, replies, or meetings.
Review deliverability weekly; review subject lines and copy per test, not on a fixed calendar.
Set guardrails, bounce spikes, complaint thresholds, sharp deliverability drops that trigger an automatic pause, not a Slack message you'll see three days later.
Don't declare a win on open rate alone. Ever. The validator has to move too.
What to actually look for in your tooling:
Some way to separate likely bot/scanner activity from real human engagement, or at least visibility into it.
Reply classification and meeting attribution — not just opens and clicks.
Built-in deliverability protection — something that flags or pauses sending when bounce or risk signals climb.
We went in assuming open-rate benchmarking would be the main lever for scaling outbound. It wasn't. The scaling decisions that actually held up were the ones paired with real downstream proof — qualified replies, meetings booked. Treat your open-rate target as a gate you need to clear, not the finish line.
Scenario | Primary metric | Validation metric | What “below standard” usually indicates | Next action |
|---|---|---|---|---|
B2B newsletter | Open rate (delivered) | CTR or CTOR | Segment fatigue, deliverability drift, weak subject lines | Segment first, then subject-line test; verify deliverability |
B2C promotion | CTR | Open rate trend + conversion | Offer mismatch, timing issues, list quality decay | Offer/segment test; sunset unengaged |
Transactional | Delivery and open rate | Downstream completion rate | Inbox placement issues or broken templates | Deliverability audit; render test across clients |
Cold outreach | Reply rate | Qualified replies + meetings booked | ICP mismatch, domain reputation issues, scanner noise masking reality | Fix targeting and deliverability; rewrite first line and CTA |
FAQ
What is a good open rate in 2026?
A good open rate in 2026 is the rate that is above your own historical baseline for the same audience and email type, and it should move in the same direction as a validation metric like CTR, CTOR, replies, or meetings. If opens rise but validation metrics stay flat, treat the open change as likely noise or deliverability artifacts.
Are standard email open rates still reliable after Apple MPP?
Standard email open rates are less reliable as a measure of attention after Apple MPP because some opens can be generated by image prefetching. Opens are still useful as a directional signal for inbox placement and subject-line testing, but you should validate with CTR/CTOR or reply-based metrics.
Should I benchmark opens by industry or by email type?
Email type is usually the stronger first split because transactional, newsletters, promotions, and cold outreach behave differently by design. Industry can refine the benchmark later, but only if the benchmark source clearly defines the dataset and measurement method.
What should I optimize if my open rate is “below standard” but clicks are fine?
What's a good open rate in 2026?
Honestly, it's whatever beats your own historical baseline for that audience and email type. And moves in the same direction as CTR, CTOR, replies, or meetings. If opens go up but nothing downstream follows, that's probably noise or a deliverability quirk, not a real win.
Can I even trust open rates anymore, post-Apple MPP?
Less than you used to, yeah. Some of those opens are just image pre-fetching, not humans. Still useful for spotting inbox placement issues or testing subject line. Just validate anything that matters with CTR, CTOR, or replies.
Should I benchmark by industry or by email type?
Email type first. Transactional, newsletters, promos, and cold outreach behave so differently by design that industry comparisons come second, and only matter if the source is clear about its dataset and methodology.
My open rate dropped but clicks are fine — what do I fix?
Don't touch your copy yet. Check for measurement shifts first — client mix changes, Apple Mail share creeping up, filtering changes — and rule out deliverability issues. If clicks are steady, the people who matter are still reading you, even if the tracking pixel says otherwise.

Written by Leah Nguyen
Read Next
View all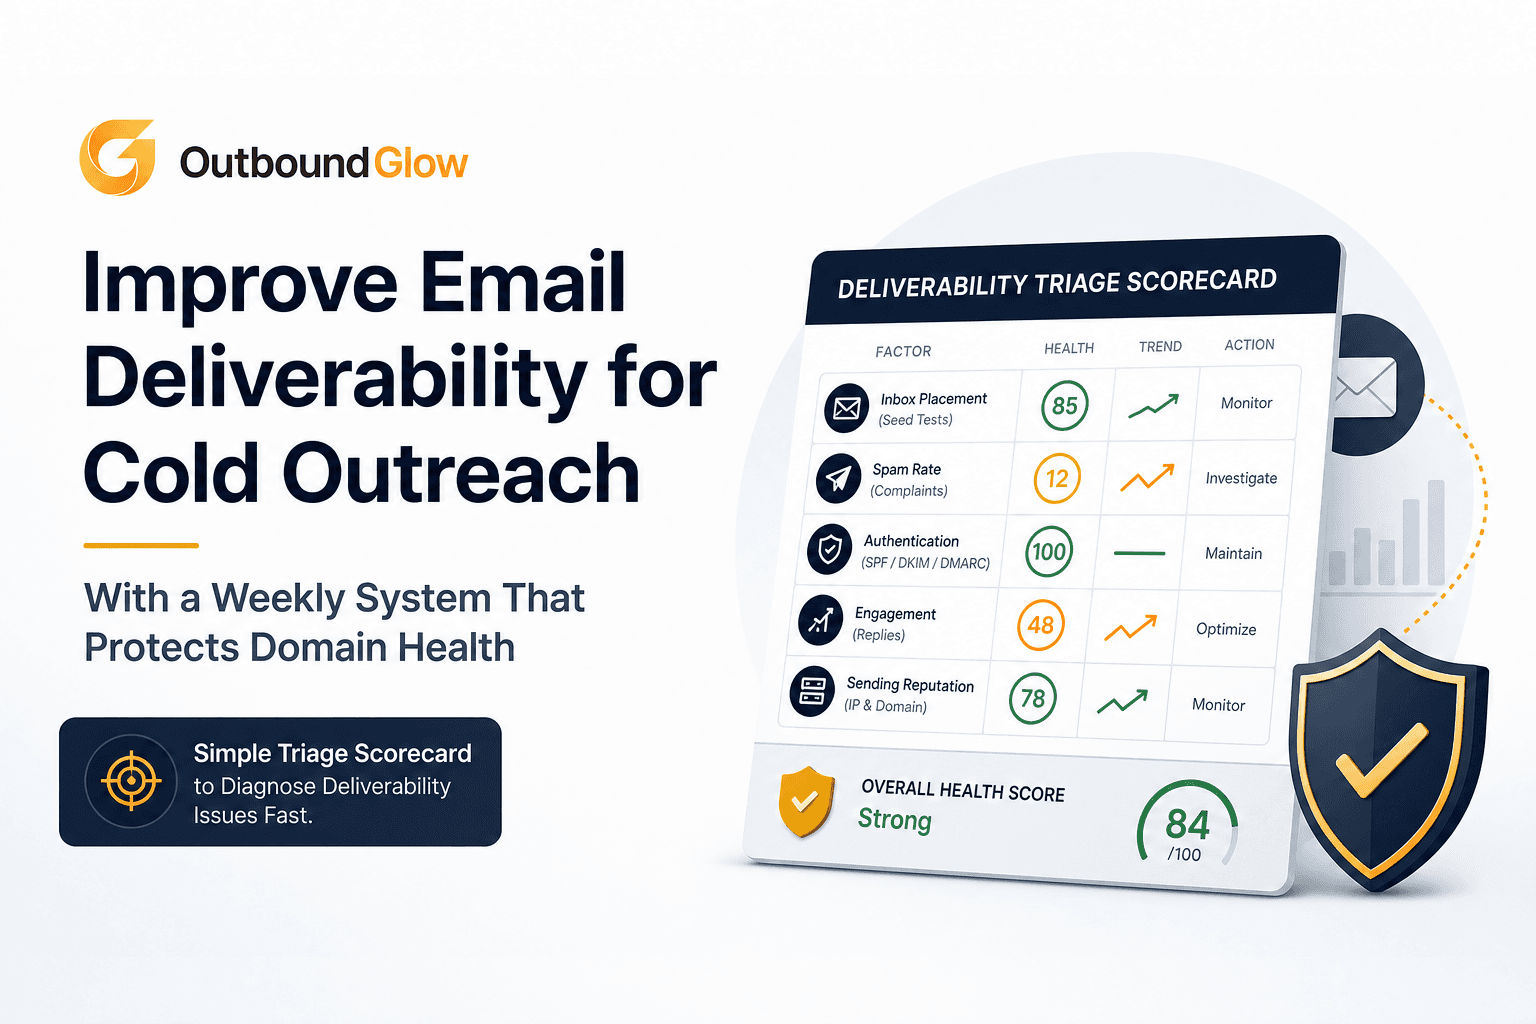
Improve Email Deliverability for Cold Outreach With a Weekly System That Protects Domain Health
Improve email deliverability for cold outreach with a weekly scorecard, ramp plan, and safe personalization to protect domain health.

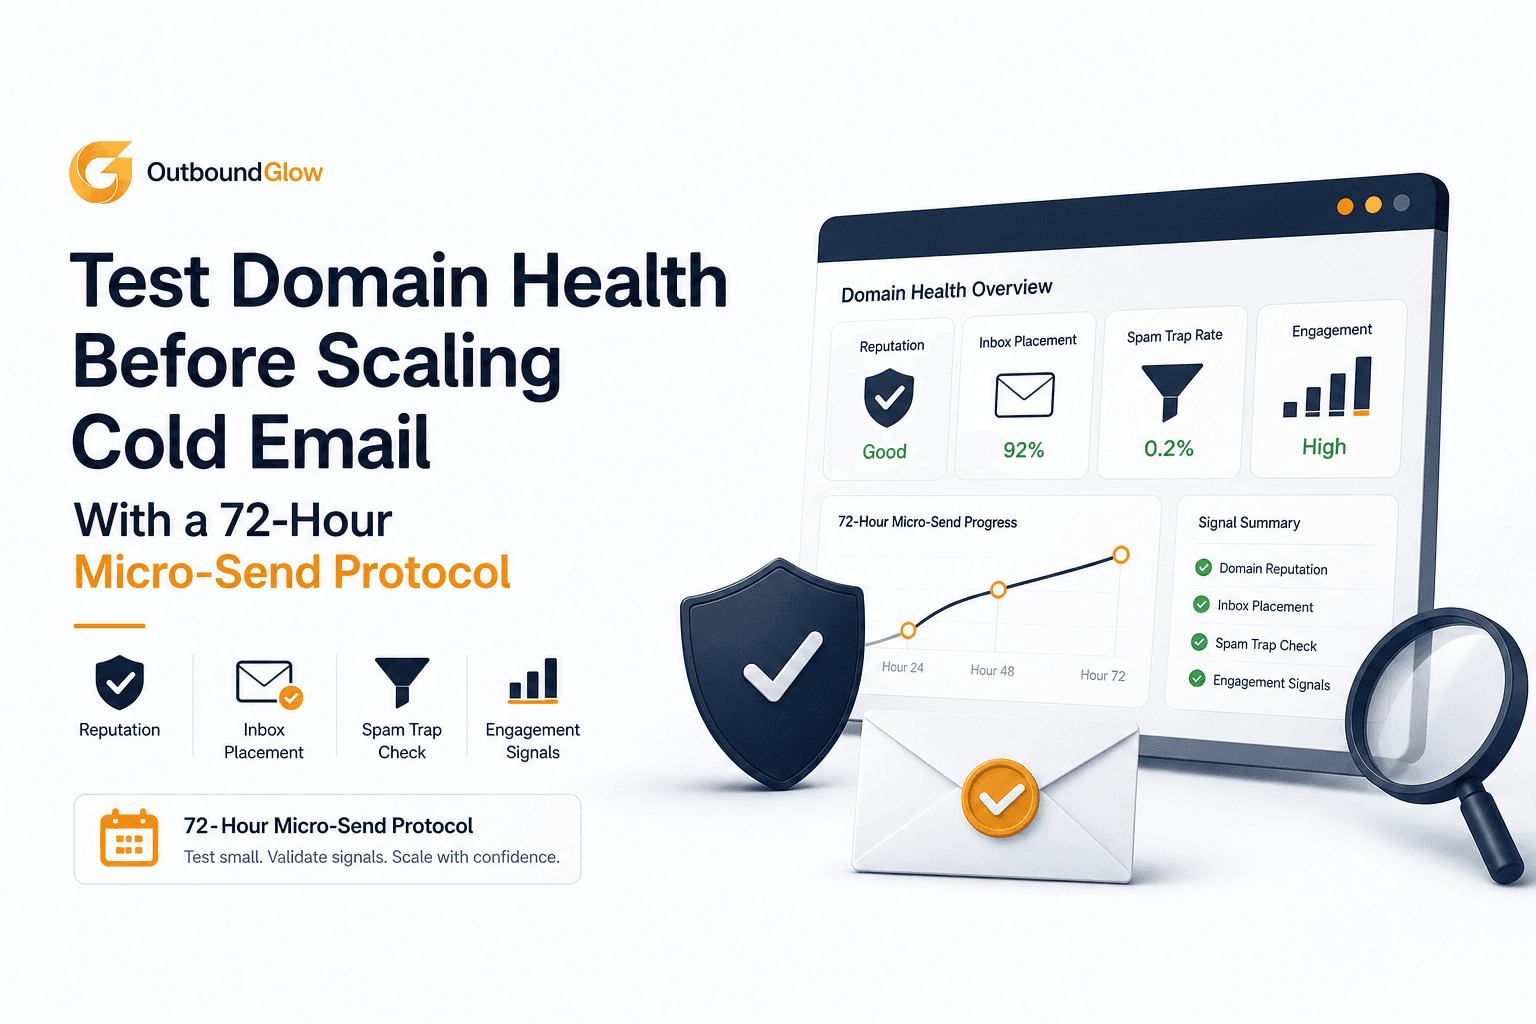
Test Domain Health Before Scaling Cold Email With a 72-Hour Micro-Send Protocol
Learn how to test domain health before scaling cold email using a 72-hour micro-send protocol, go/no-go thresholds, and fix paths.
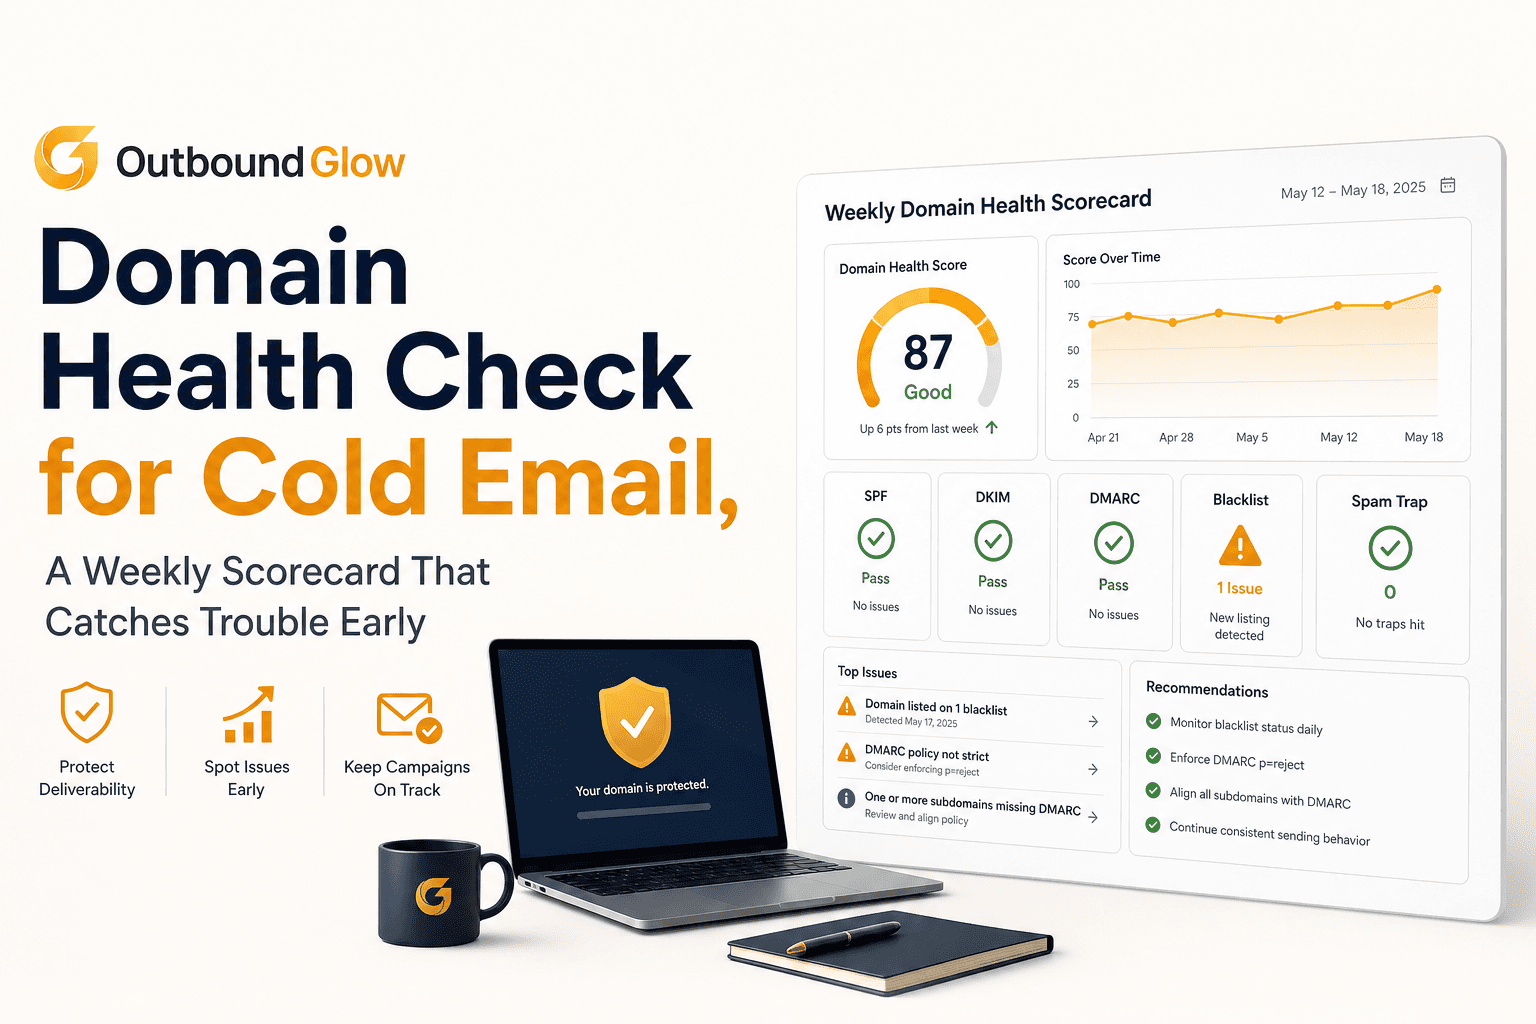
Domain Health Check for Cold Email, A Weekly Scorecard That Catches Trouble Early
A weekly domain health check scorecard for cold email: what to measure, safe thresholds, and a fix-first playbook when deliverability drops.